Epilogue: Our lessons learned building analytics startup Whywhywhy
January 4, 2023 by David Kjelkerud & Matt Holden
This is what we learned from building Whywhywhy over the past two years. We hope it will be useful to founders who are considering tackling problems in the analytics/BI space. If you’re curious about how the product worked, check out whywhywhy.com before reading on.
Whywhywhy let you quickly create interactive charts and share them with your team in communication tools like Slack, Notion, or Google Slides. Our vision was to enable anyone to answer questions using data. As product builders, we were frustrated with the limits of existing business intelligence (BI) and analytics tools. They seemed to always get in the way of our curiosity. Inspired by personal data tools like Excel and Jupyter notebooks we set out to make a new kind of data analytics tool, accessible to anyone.
We had three core assumptions:
- Target business users, not the data team.
- Create an accessible data analysis and storytelling format.
- Go to market through bottom-up adoption.
For two years we explored these ideas, pivoting several times, and eventually concluded that we just couldn’t find a way forward. Probably the most vexing thing is that when you talk to users it seems like no one is happy. There are problems everywhere, so we got amped about the potential to serve a large audience of frustrated users. But it turns out that problems in data are hard to isolate and address. Let’s go through our core assumptions and see why.

Matt and Mark hacking
Assumption 1: Target business users, not the data team
When we started the company, we had a strong desire to make data analytics more accessible to people outside the data team. We were inspired by tools like Excel, Airtable, Notion, and Canva which had both low floors (accessible to non-experts) and high ceilings (very powerful as you learn more).
We initially tried selling to PMs & growth teams, as personas we knew well that used data to build better products. We spent months selling and iterating, but couldn’t find a good path into organizations through this persona.
Talking to a head of product or growth, we’d hear: “This looks great! I’d love for my team to be able to use this, but you’ll need to talk to our data team—they own tools like this, not my team.”
For users outside the data team, the challenge is that they don’t have easy access to data. Sure, folks can kick the tires by uploading CSVs or maybe connect to a SaaS tool they have access to. However, pretty quickly users will want to connect to their live company data which most of the time is locked away in a data warehouse. Users can get a vague idea of the value of your product by playing around with demo data, but using it with their live data is the only way they’ll know for sure.
We had chosen two incompatible constraints: We needed users to bring their data to use our product and we targeted users who didn’t have easy access to that data. No bueno!
If you’re thinking of selling an analytics tool outside the data team, you need a strategy for how users will get data into your product. Analytics products like Mixpanel, Google Analytics, and Posthog solve this by integrating data capture, which makes them easier to try out since you don’t have to give another tool the keys to your data warehouse.
Assumption 2: Create an accessible data analysis and storytelling format
When we looked at existing analytics tools we didn’t see many formats for creating and communicating analytics and insights that we liked. Dashboards work well for monitoring, but are bad for storytelling. Spreadsheets are great but don’t work well with big, live, data. The format that most inspired us was the computational notebook.
Being an exploration and communication surface in one appealed to us and felt like the right shape for a next-generation data tool. It had one problem though: it required you to code. We got excited about taking the form of notebooks but making it accessible for people who don’t code.
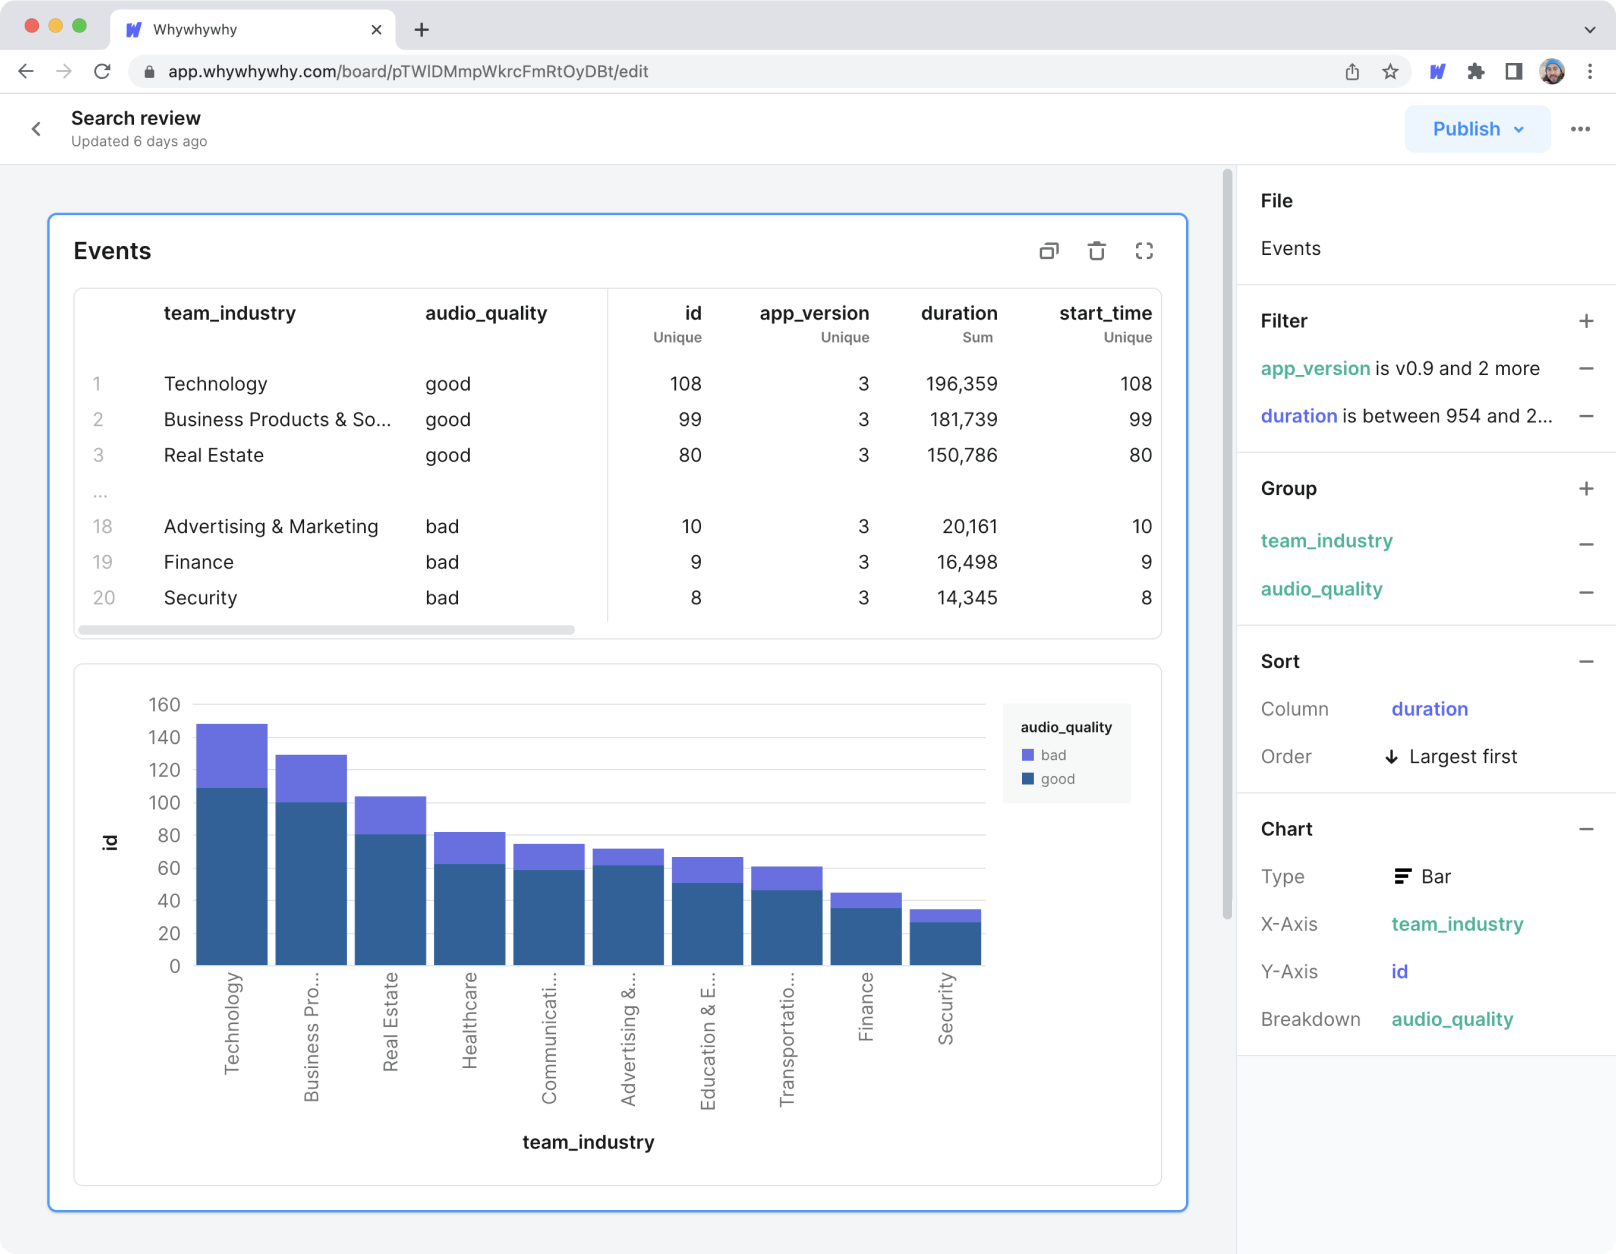
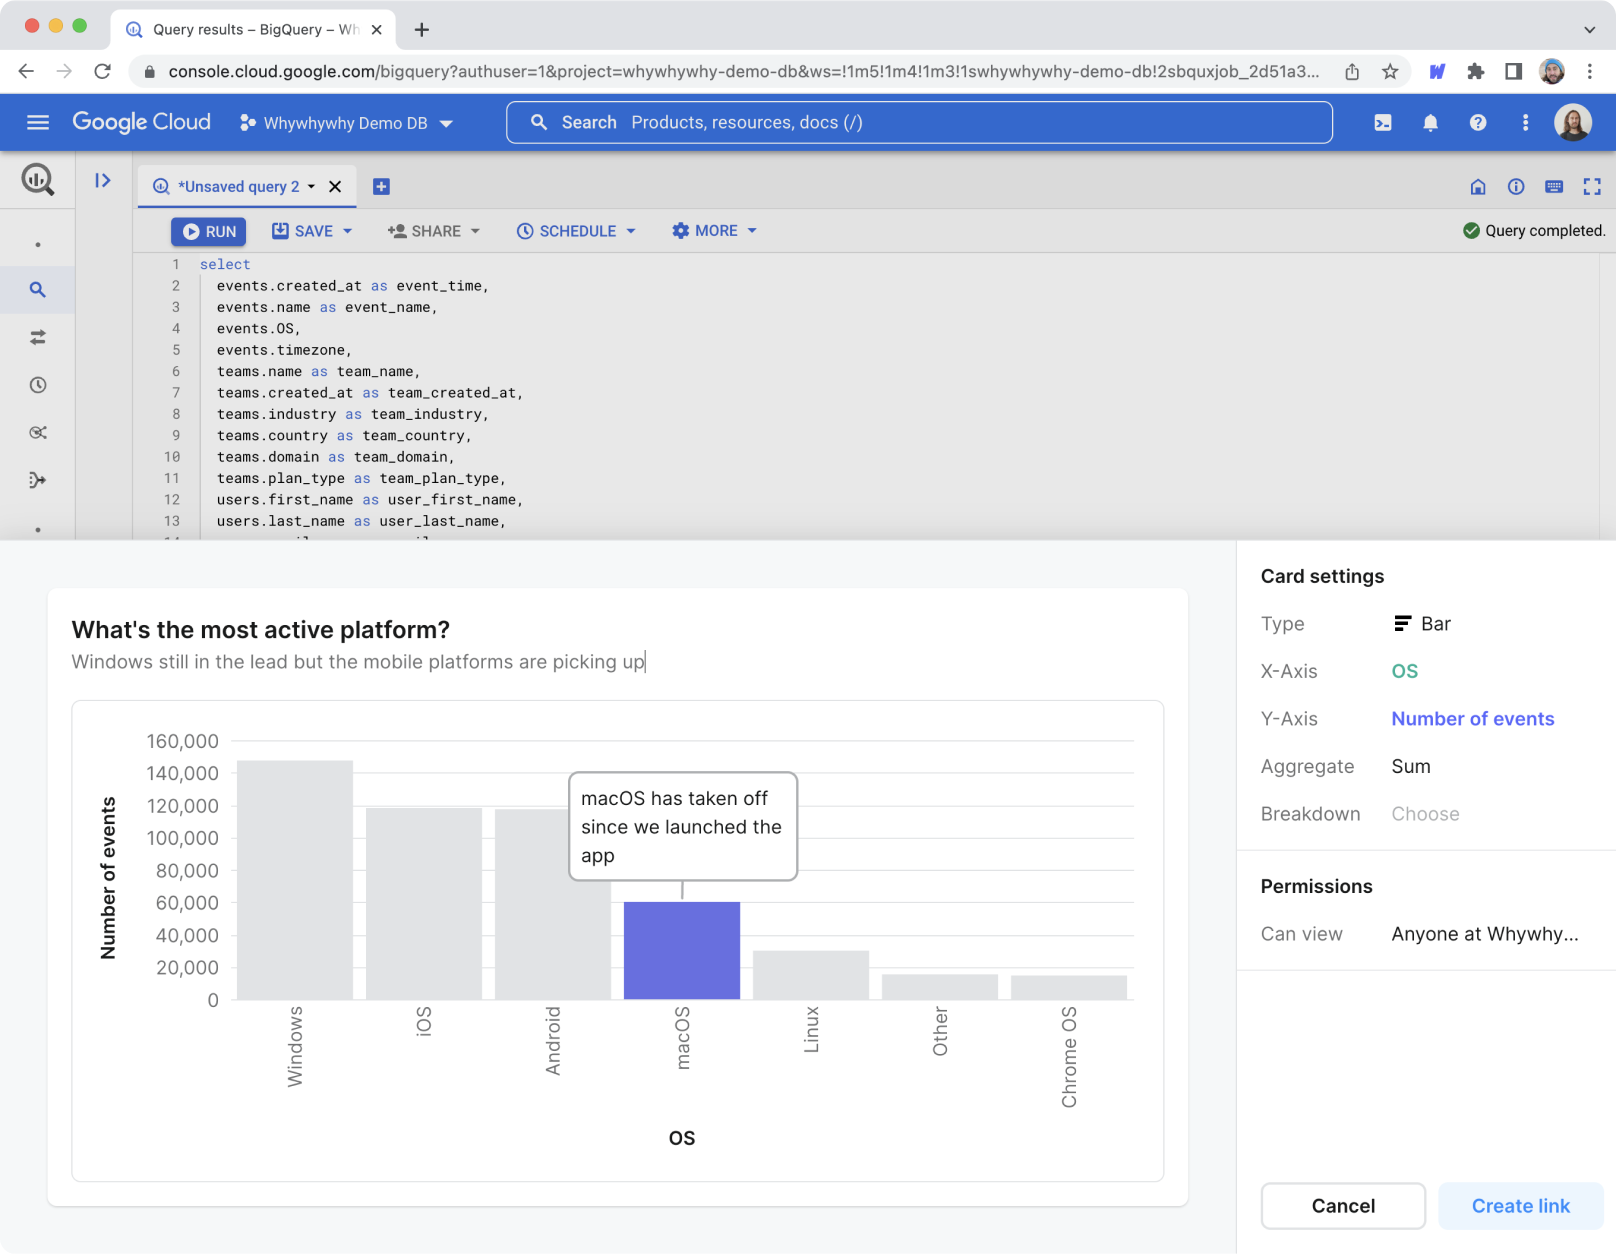
The Whywhywhy editor and card format—Analyze data by adding actions to a sequentially executed list of steps.
With this no-code notebook as a canvas, we explored use cases that would be our initial wedge. A wedge is a very narrow user problem and segment that can grow bigger as you improve the product. We had built a broad product that could be useful for many things, which made it important for us to find a deep use case that would let us get user feedback as soon as possible.
But we never found that wedge. Eventually, we moved focus from the no-code notebook to narrow sharing use cases for analysts, but still, it wasn’t sticking. What was the problem?
It seems to us that analytics resists narrow wedges. It’s a sprawling, interconnected problem space. There are integrations everywhere and one user’s data doesn’t look like anyone else’s.
Many of the data tools that have found strong product/market fit (such as Snowflake, Looker, Fivetran, or Tableau) are very wide and quite general tools. They cover a huge surface area of features, integrations, and use cases. The MVP bar for a data tool is quite high.
Also, BI is a mature and broad category. It might feel like it should be ripe for unbundling given how many jobs that single piece of software does (and dbt has shown that it’s possible for the modeling part). But visualization and reporting is BI’s bread and butter and it’s not obvious to us how you wedge yourself in from that angle.
Assumption 3: Go to market through bottom-up adoption
We were convinced that to change the status quo in the space we would need a differentiated distribution strategy. BI tools are software Swiss Army knives (OK at many things, great at none) sold to organizations in a sales-driven process. In other words, BI suffers from the typical enterprise software conundrum: When the buyer is not the user you end up with bloated products that are hard to use.
If your product can be adopted by end users in a bottom-up fashion you can be laser-focused on solving their problems and building a great product. We were naturally inspired by SaaS giants like Slack, Figma and Dropbox, but even more so the early days of Tableau and Excel which proved to us that it’s possible to create an analytics tool that’s adopted bottom-up.
So what makes a product a good fit for bottom-up adoption? Pete Kazanjy proposes four questions in this great article:
- Is the product simple enough for bottom-up adoption?
- Can this co-exist with a (less good) incumbent in a given company’s stack?
- Will you focus on small organizations?
- Is this truly new and differentiated?
If the product is in the BI category, or if it’s doing similar jobs to BI products, the answers to these questions are muddled at best. Let’s see why.
Is the product simple enough for bottom-up adoption?
For a product to be successfully adopted bottom-up, it has to be really easy for users to try it out and quickly understand whether it’s valuable. For business users, the answer to this question is no, because they they usually can’t connect new tools to company databases themselves.
For users on the data team it’s more tractable, but if your product is about sharing it becomes a team product so no longer can an individual as easily decide whether to adopt. Since sharing was a key value prop for Whywhywhy we hit this friction quickly. Data integration and security concerns are also significant barriers to trying a new BI tool quickly.
Can this co-exist with a (less good) incumbent in a given company’s stack?
Data teams often feel uncomfortable actively adding more places where charts, reports, and dashboards live, because it inevitably leads to confusion: “Which of these numbers are correct? The one in tool A or tool B?”, “Where should I look for that metric?”, etc.
One of the most painful problems in data is having inconsistent metrics and more BI tools contribute to the problem, so the bar is high to add another one. The reality is that most larger teams end up with multiple BI tools to serve varying use cases and departments, but just because it’s the reality doesn’t mean it’s an attractive sales proposition to data teams. Having multiple sources of truth just sounds like trouble.
Will you focus on small organizations?
A way to avoid incumbents is to target early startups and small organizations and get in before they have picked a tool. Targeting startups with a bottom-up strategy generally works well—there’s less red tape and you can iterate quickly together with your early customers. However, early-stage startups have only basic needs when it comes to BI and reporting.
Tristan Handy (dbt founder) put it well:
At this stage, you have no resources and no time. There are a million things you could be measuring, but you’re so close to the details of your business that you’re actually able to make fairly good instinctual decisions.
We tried targeting early-stage startups but the jobs we solved were too niche for them. While startups’ data needs are basic compared to large companies, frustratingly they are at the same time varying and broad. This makes it difficult to create a focused product that delivers deep value, early on.
Is this truly new and differentiated?
Products that provide something truly new and differentiated can avoid being compared to existing products and create a new category in the customer’s mind. User session recording tools like LogRocket and FullStory are competing indirectly with BI tools, but because they are so different, users don’t compare them directly.
We were never able to escape being compared to the BI category. Because the core of Whywhywhy was always visualization, reports, and sharing, users mapped it to what they knew. It simply wasn’t differentiated enough.
To summarize, while there have been some exceptions (such as Metabase), we believe BI today is not a great fit for a bottom-up distribution model. Or at least bottom-up isn’t the disrupting strategic choice that we thought it would be.
That doesn’t mean that bottom-up in BI won’t happen in the future, but a technology change probably needs to happen to open the space up. Maybe it’s the metrics layer. Maybe it’s some way that makes it easy to securely let end users access data from the data warehouse in the tools they prefer.
Time will tell.

Whywhywhy office in Boulder
What did we get right?
While some of our hypotheses didn’t pan out, what did we get right?
First, we built around two amazing core technologies: DuckDB (a very fast embedded analytics database) and Apache Arrow (a universal format for tabular data). The combination makes it easy to crunch millions of rows of data in memory at near instant speeds. Both are free and open source, and we’re excited about the new possibilities they’ll enable.
Second, WebAssembly has made the browser much more powerful. Until recently, if you were processing large datasets, you had to use servers (like Snowflake) or build a native desktop app (like Tableau). WebAssembly is only a few years old, and enables compiling languages like C++ or Rust to fast binaries that run in the browser. If your datasets fit in memory (i.e. up to a few GB), new technologies like DuckDB-Wasm offer near-instant querying with zero server latency—pretty sweet!
Lastly, we believe the future of BI will increasingly be embedded in other applications teams already use. Many people find analytics tools hard to use, and data teams often struggle to get adoption for dashboards or BI tools. As we see document formats like Notion, Coda, and Google Workspace getting richer, we think analytics results will be consumed in context with narrative and visuals, rather than being trapped in BI siloes.
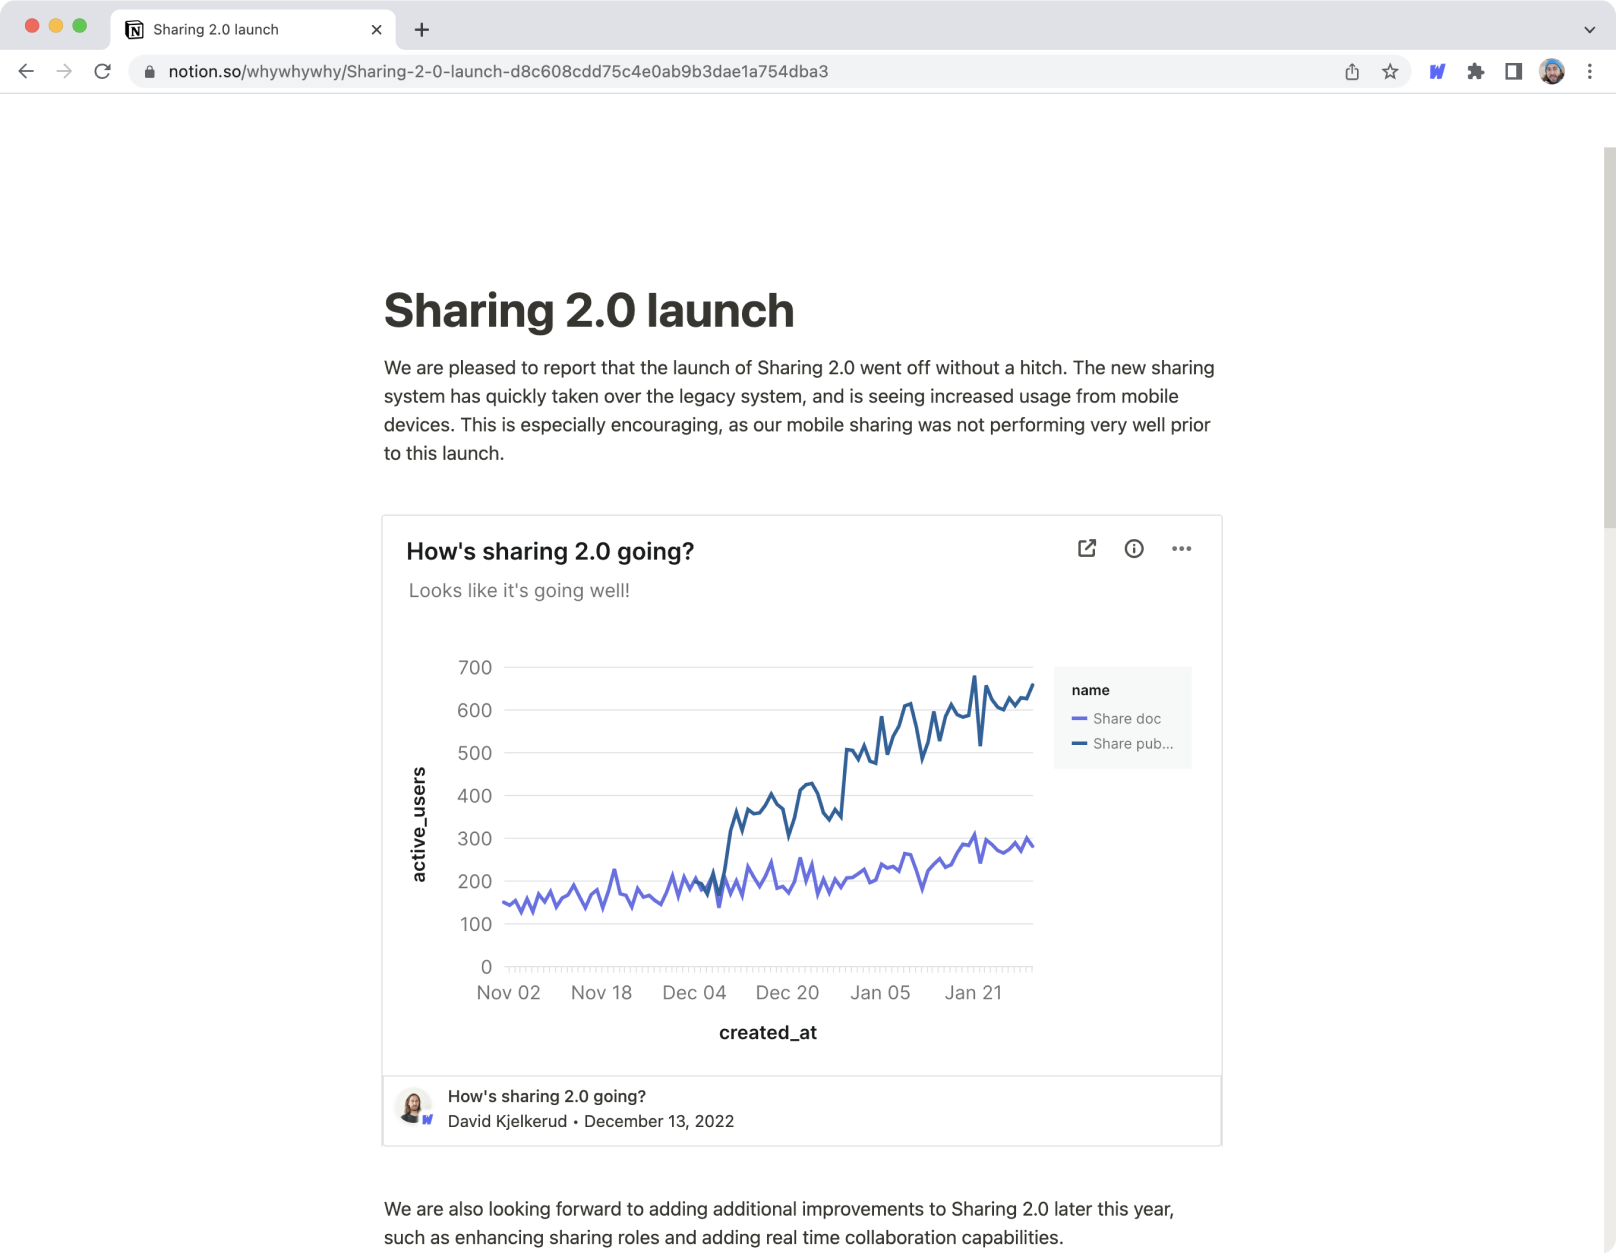
An interactive Whywhywhy card embedded in Notion.
Final thoughts
As a founder, you need the ability to suspend disbelief. There are so many reasons you could kill ideas and stop doing what you’re doing. We’re proud of having taken a swing with an ambitious idea even though our hypotheses proved to be wrong this time. If you’re reading this and thinking about starting something in the space, don’t feel discouraged. Data needs more innovation, and new startups will eventually solve the problems we couldn’t.
If you have any questions or want to know more about Whywhywhy, please reach out to us.